OPTIBOX
PLATFORM OVERVIEW


CONTRIBUTORS TO THE OPTIMIZATION PROCESS
.jpg)
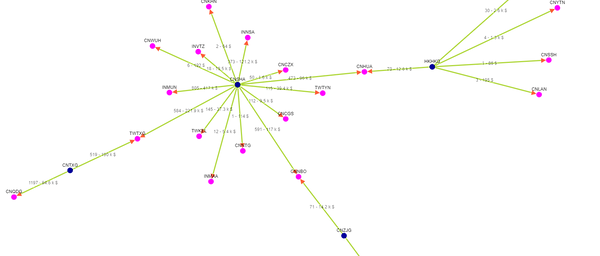
EMPTY CONTAINERS MOVED FROM SURPLUS TO DEFICIT LOCATIONS
A graphical display of empty containers moved from surplus to deficit locations reviewed by volume, cost, regional movement as well as within the network.
An indicator demonstrating port wise
relocation showing origin and destination
that are serviced from a surplus and received
in a deficit location.
.png)
Graphical view of how the containers are moved in and out of a specific location. It gives the location name, count of containers and the cost of moving from the surplus to deficit location.

The results of the optimizer versus a manual simulation executed in the system.

A graphical representation of all surplus and deficit locations across the globe using a map pointer.
A user can also view the specific requirements of a region, country or location with total export and import counts.
DATA PROFILING

A representation of the data being profiled.
TRANSIT TIME PROFILING

Transit time profiling of port pair.
SURPLUS AND DEFICIT LOCATION IDENTIFICATION

Global view with a surplus/deficit and neutral identification for each location in the map.
PREDICTIVE ANALYTICS

Data cleansing of the customer’s raw data and is used for data analytics.
